I'm putting on my armchair-data-scientist hat for this one (and probably also showing off just how dorky I can be.) About two years ago, I started tracking data on my reading material. It began as a self-improvement initiative to learn to read faster and more effectively, but soon I was going down a "life-tracking" rabbit hole. My theory, at the time, was that reading rate would be affected by time of day, but the first attempt to prove this didn't actually show anything conclusive. For some reason though, I've kept up the tracking for the past 2 years, and even refined my methods. Now I have a second, more thorough study of my reading rates.
Jump to:Books | Collecting Data | Scrubbing | Extrapolating | Analyzing
The Books
While the previous study only examined 2 books, this second study has spanned 8 books in a decent variety of genres:


- The Pleasure of Finding Things Out - Richard Feynmann - A collection of essays, speeches, and other short writings by one of my favorite scientists. Lots of overlap with "Surely you're Joking Mr. Feynman," but it's still good.
- Thinking, Fast and Slow - Daniel Kahneman - VERY dense reading, which I'm actually still getting through. It details the psychological work of Kahneman as he decodes and explains the two models of brain activity.
- Invention by Design - Henry Petroski - One of my new favorite books I have ever read. Through case studies, it presents several different aspects of the engineering process.
- The Secret Life of Bats - Merlin Tuttle - A fascinating memoir of a field biologist and the bats he studies. I would highly recommend it.
- The Foundation Trilogy - Isaac Asimov - I'm counting this as three separate books. The series is a scifi classic, and is also the only fiction in this set.
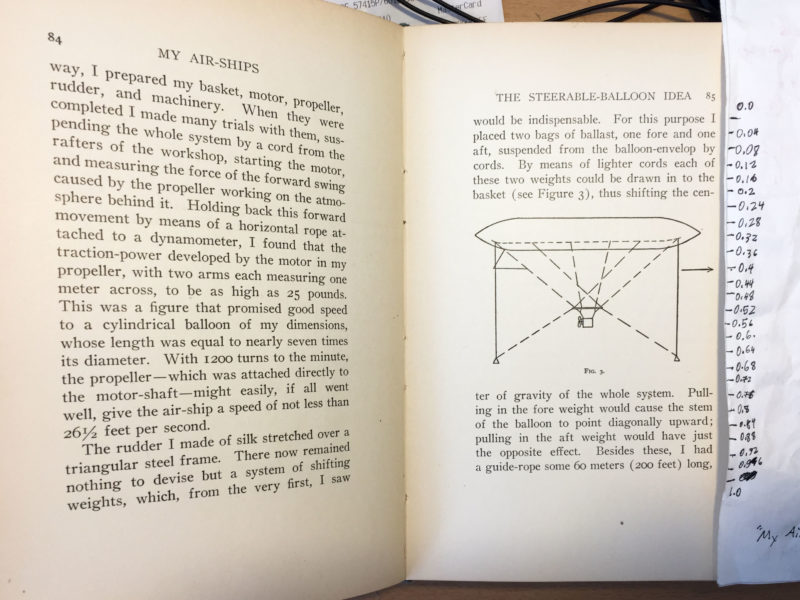
- My Air-Ships - A. Santos-Dumont - I think I love this book equally as much as the Petroski Book. It is another memoir by the inventor of airships, and is an inspiring glimpse into his thinking.
Collecting the Data
After the initial reading rates study, I was determined to make data more easily captured and more accurate. Originally, I had tracked everything manually by writing current page and time on my bookmark, but this was just too tedious to enter in the data.
This time, I made a form linked to a spreadsheet, which I then bookmarked on my phone. I set it up to simply say whether I was starting or stopping, and relied on the time stamp of the form entry to track actual start/stop time. There's also a spot to write which book I was reading, page number, notes, and a subjective evaluation of how engaging the material was.
To improve the accuracy of data, I wanted a more specific way to gauge word count, so I created a page-ruler along the side of my bookmark to measure my way down a page. This system relied on the assumption that each page within a book would have a standardized number of lines. For each book, I would find a full page of text, and tick marks down the page at each line. Then, based on the number of ticks, I calculated and wrote amount of page complete. The top of the page would be 0 and bottom of the page would be 1. Then, when I entered page number, I could measure down to say I was on page 85.24. These rulers also came in useful later, while scrubbing data, when I needed to subtract how much of a page was taken up by images.
"Scrubbing" the Data
From here on out it's all spreadsheet geekery...
The data "scrubbing" was particularly painful, but I needed to make sure the form data was appeared in a consistent, usable way. When submitting the form, I didn't always type out the entire title, so I had to go through and make each title consistent. I had also used the "notes" section to tag when there were pictures, so I had to go back to those sections, measure each picture, and subtract that from the final page number. I also had to check for typos, or start/stop mix ups.
While counting pages is useful for looking at my progress through a book, it's less useful for comparing one book to another. Since not all books are spaced identically, I needed an approximate word/page for each book. Once I had the data cleaned up, I set about counting words, which is even less fun than it sounds. I experimented with taking a photo of a page and running it through OCR (text recognition) to see if I could automate this step, but the software could only produce garbled results. I counted 5 pages per book and took an average:
| Title | Author | Average W/P |
|---|---|---|
| Thinking, Fast and Slow | Daniel Kahneman | 437.4 |
| The Pleasure of Finding Things Out | Richard Feynman | 355.6 |
| Invention By Design | Henry Petroski | 421.2 |
| The Secret Lives of Bats | Merlin Tuttle | 318.4 |
| Foundation | Isaac Asimov | 324 |
| Foundation and Empire | Isaac Asimov | 354.2 |
| Second Foundation | Isaac Asimov | 352.6 |
| My Air-Ships | A. Santos-Dumont | 193.8 |
Extrapolating Data
With all the data "scrubbed" and the books averaged for page count, it was time to start pulling the data apart and extrapolating more meaningful information from my tracking chart (snippet below):
| A | B | C | D | E | F |
|---|---|---|---|---|---|
| Timestamp | Book | Page | Action | Engagement | Tags |
| 9/30/2016 23:25:09 | Thinking, Fast and Slow | 255.42 | Start | ||
| 10/1/2016 0:08:17 | Thinking, Fast and Slow | 265.34 | Stop | 2 | pix |
| 10/9/2016 13:04:55 | Invention By Design | 1.28 | Start | ||
| 10/9/2016 13:21:54 | Invention By Design | 7.18 | Stop | 5 |
- Duration
=if(D3="Stop",A3-A2)
I started by calculating time spent reading. My formula first checks to only affect "stop" rows, then it subtracts the timestamp of that row and the one above. - Pages
=if(D3="Stop",C3-C2)
It was the same approach to extract how many pages I had read. - Words/Page
=VLOOKUP(B3,'Book Data'!$A$3:$C$11,3,FALSE())
One column was dedicated entirely to looking up the word count of the book from the sheet where I'd averaged them. - Words/Minute
if(D3="stop",(I3*H3)/(HOUR(G3)*60+MINUTE(G3)))
I used the first three calculations to get to words per minute, the main value I was after. I had to do some tweaking of formats to convert everything into minutes. - Date
=Datevalue(A75)
Who knows, maybe there's something interesting I can do with the date. - Time
=IF(D75="Stop",A75)
I might also revisit my original search for time of day coorelations. - Session Duration
=if(D75="Stop",if(K75=K73,G75+M73,G75))
This was a tricky formula to come up with. Basically, it's answering the question "How long have I been reading today?" Most of the data entries are broken up by chapter sections, so the "duration" calculation isn't fully reliable for this. I want to see if there's a duration at which reading rate slows down.
Analyzing the Data
Finally, we come to the good stuff: comparing one variable to another and seeing if anything interesting pops up! I suspected the best way to reorganize data for comparison is with a feature I don't often use: pivot tables. However, because I don't really know how they work, there was a lot of trial and error. Also, since the pivot tables are meant to summarize data, I was faced with a question of how best to do that. Most people use averages as a default summary, but I've read that that Median is sometimes the better options. I did a little research on the differences between the two, and I learned that it all comes down to the distribution of the data. If the evenly distributed across a bell curve, an average is sufficient, but if the data is skewed, then a Median provides a better summary. Unfortunately, my statistics/spreadsheet-wizardry knowledge falls short of being able to determine the data's distribution, so I'm playing it safe and defaulting to median.
So finally, some charts:
Engagement vs Reading Rate
The first interesting comparison I found compared my subjective "engagement" rating (how much I liked what I was reading) against the rate at which I was reading it:


Originally, I grouped it by the average engagement rating of each book, and was excited to see that there was a trend: As I became more engaged in what I was reading, the rate at which I read seems to increase as well, which makes sense on an intuitive level. When I checked this comparison across every data entry, the individual data seems to confirm the correlation, but also shows a wide spread, suggesting the correlation might be a bit weaker. I suppose limiting the rating to a 5 point scale is a bit limiting, especially when comparing it to a continuous set of data like reading rate.
Duration vs Reading Rate
I'm still grappling with how to make pivot tables behave for my needs, so it took a lot of fussing around in google sheets to create this next chart. Again, I have a theory that my focus and energy are going to slow down as time stretches on. I also managed (somehow) to get this to chart to group by book.
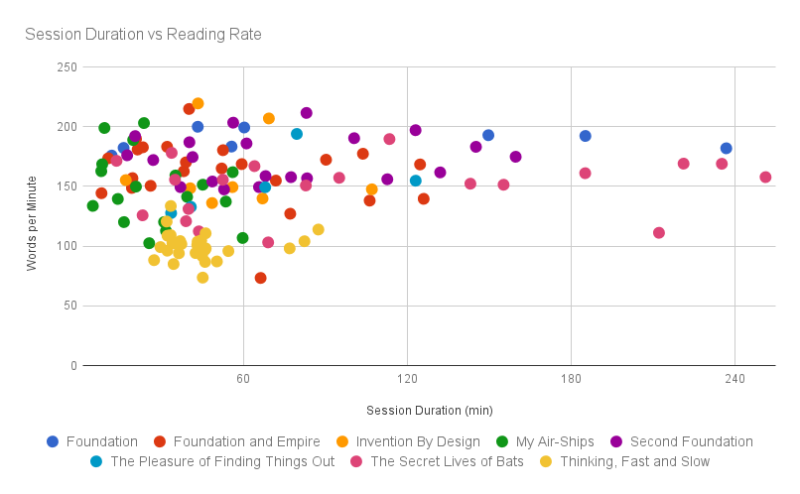
It seems like the vast majority of reading sessions lasted an hour, but the reading rate holds steady or even levels off as duration stretches out beyond that. It's also interesting to point out that the book I was least engaged with "Thinking Fast and Slow" is clustered very much in the lower reading rate lower session duration area. Guess I got tired of grinding through that book a lot quicker.
Time of Day vs Reading Rate
I also checked my old hypothesis that reading rate might be affected by time of day, ad it looks like my original conclusion is holding strong: nope. Although there doesn't seem to be a correlation, there's also not a continuous set of data stretching throughout the day.
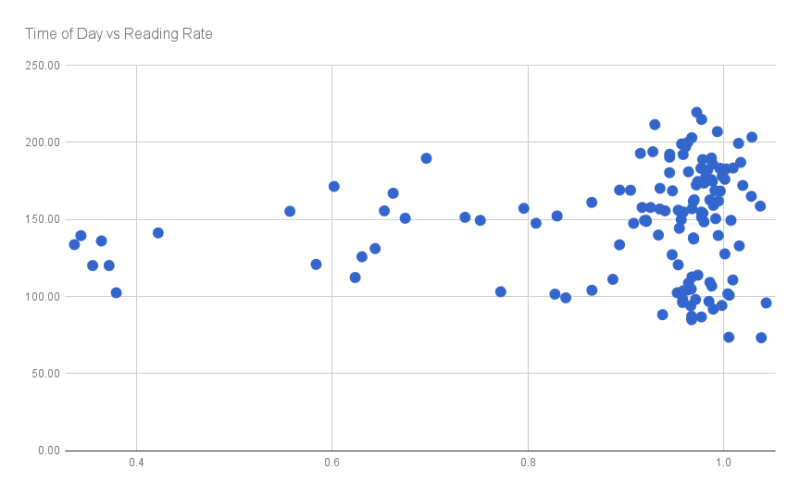
I will say, this chart was particularly difficult to create due to the way google sheets handles it's time/date stamps. Although the X-axis represents time of day, it doesn't really show a "time." In order to keep it from moving the midnight entries back to the beginning of the day, I had to get creative with the extrapolation of the TIME variable. Basically, where the chart shows 1.0 should map to 12:00 am. There were some reading times that happened in the morning. Those values on the left start at about 8:15 am. Clearly there's a dominant time of day in which I find time for my reading: as the last part of the evening.
I think the weak link in this whole process is my ability to line up the data properly for charts. While the pivot tables help me pull data from the originally entered source, I'm still having trouble putting it in the right place, and the google charts are actually frustratingly picky.
Conclusion
Although it's fun to see the results, I don't know that there's anything to inform my original goal of becoming a faster reader. I get through more engaging material quicker, which is intuitive. However, sometimes the most interesting content (like Thinking Fast and Slow) is stuck behind exhaustive and dry presentation. If the material is not engaging, there's a good chance I will read slow and quit soon. If it is engaging it seems like I can read at the same rate for at least 4 hours! And once again, there seems to be no relation to time of day and reading rate.
An interesting statistic I once saw estimated the number of books an average person will read in a lifetime. While I'm afraid I don't remember the number itself (I know..cool story bro) I do remember the new perspective it gave me towards reading. I do like tracking and analyzing things like this, but entering data every chapter does pull away from my enjoyment and focus on what I'm reading. My focus is going to shift, therefore, to engaging with my reading more thoroughly.
Nice Analysis and web presentation. Scrubbing and converting the data to compare books to one another looks so painful.